Architecture
This page will explain in moderate detail how Depth works. It's not a manual, but more of a map - knowing the shape of the library can make the rest of the docs click into place.
The main flow
(this diagram took me legit 35 minutes to make...)
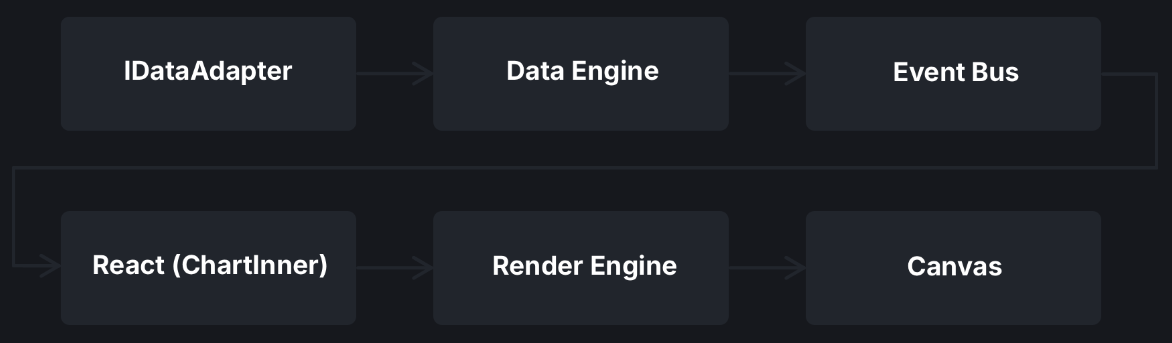
This is how data enters the chart.
Note
This is heavily simplified. It's the general flow, but keep in mind that there's a lot more going on under the hood, this is just the general gist
IDataAdapter
The data adapter doesn't just throw data at the data engine, it responds with data after a request for it, but that's pretty obvious so I left that part out.
The data adapter is the part you control - the main goal is for it to provide the chart with data like ohlcv bars, mbo events, and information about symbols.
Data Engine
After the data adapter gives the data to the Data Engine, it'll start processing it based on the data level you marked the symbol with. This is invisible to you as a developer, as you won't need to touch it. Normalizes and processes data based on the data level so the chart can function well. After it's done processing, it'll push the result to the bus.
Event Bus
The event bus is the central nervous system for the chart. Instead of passing around synchronous functions, there's instead a bus where events are pushed towards. In this case, after the data engine is done processing, it'll push the result to the event bus, where a listener parses it. The event bus is fully public for you to use and intercept events as well.
React (ChartInner)
The chart itself. Each chart in a multi chart layout has its own ChartInner. Each component instance has a subscription to a hook
which listens to the event bus for when the data is ready. So, after the data engine sends the result to the bus, a listener takes the result, parses it
and keeps the result. That listener is what each ChartInner component uses to access data.
Render Engine
When each chart is ready to render, they'll tell the render engine what to render, and gives it the necessary data and information to do that. Each chart rendering works fully independently, so they have their own instance of a render engine. The render engine is really only relevant to plugin authors.
Canvas
The last step in the process. The canvas is the final output, where pixels get painted.
The plugin system
The plugin system is pretty damn good. You can create drawings, chart types, indicators, extensions (extensions being the most powerful). They're not part of the main flow, but they deserve to be included on this page. Just really simplified, they run alongside the main chart and have access to a big part of the chart api (depending on the permissions they request) and render engine (when it's their turn to draw). This page goes into more depth of how they work internally.
DepthChart
This is the controller, it owns everything. When you call useDepthChart, the hook creates one of these. It's what chart is in { chart, element }.
Everything you do programmatically (setSymbol, use, serialize, playback, etc) goes through this. You'll use this the most. Read more here